Learn about our mission, values, and impact on coastal conservation.
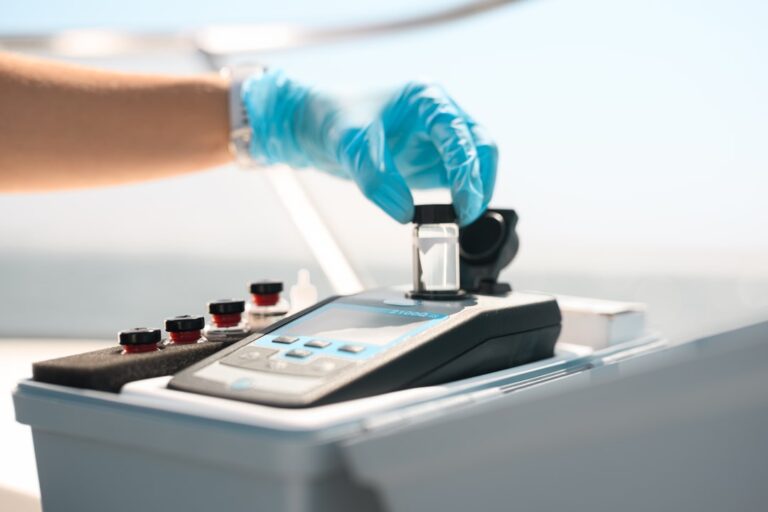
Our AccomplishmentsDiscover our successes in safeguarding San Diego's waterways. From clean water initiatives to marine conservation efforts, see how we make a difference.
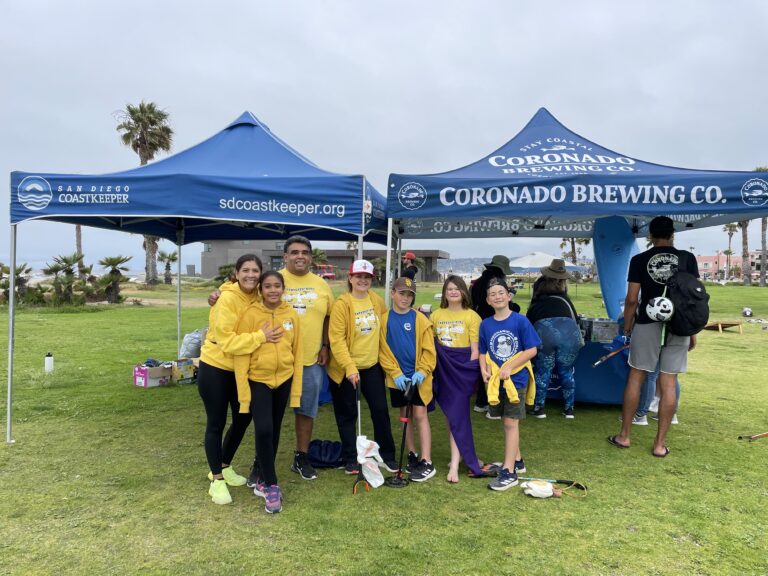
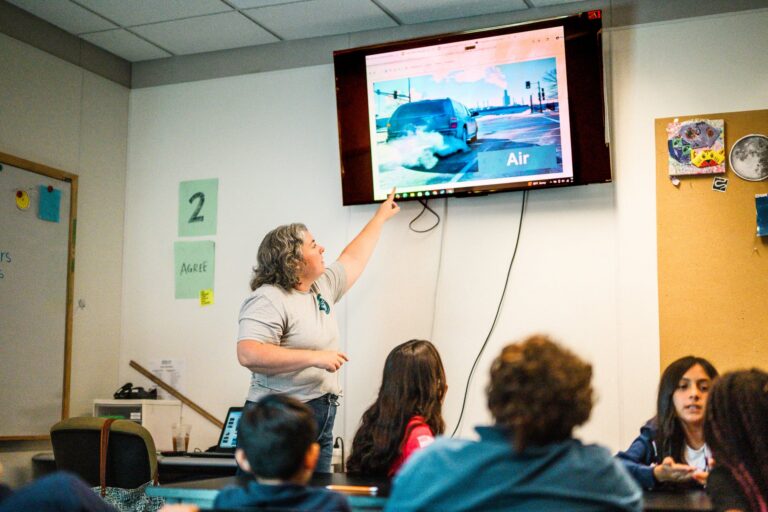
Employment OpportunitiesSan Diego Coastkeeper periodically seeks to add talented individuals to our passionate team of educators, advocates, scientists, outreach specialists, and non-profit professionals.
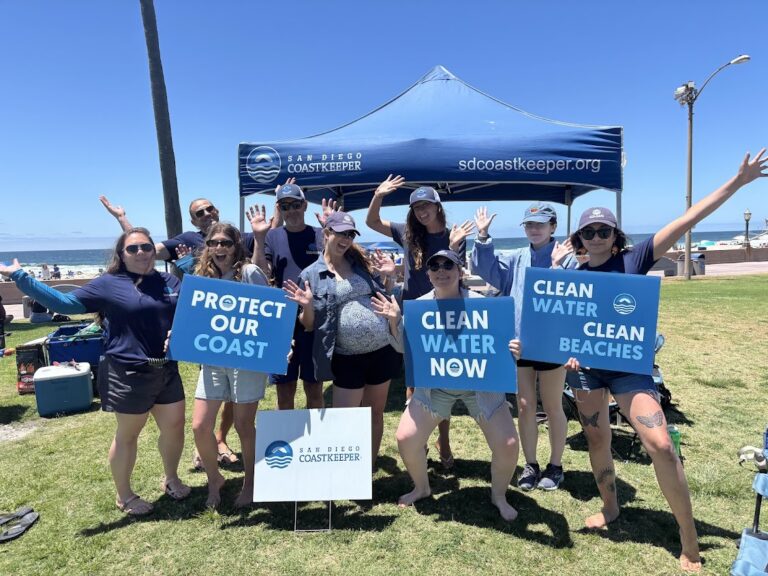
The people behind our organization make our vision for clean water, vibrant communities, and a healthy environment possible. Learn more about our board of directors and staff.
Dive deeper into our annual reports, financial statements, and tax returns.
Have questions or want to get involved? Reach out to San Diego Coastkeeper. We're here to help keep water clean, safe, and affordable.