


Mission Bay Water Quality Monitoring Program
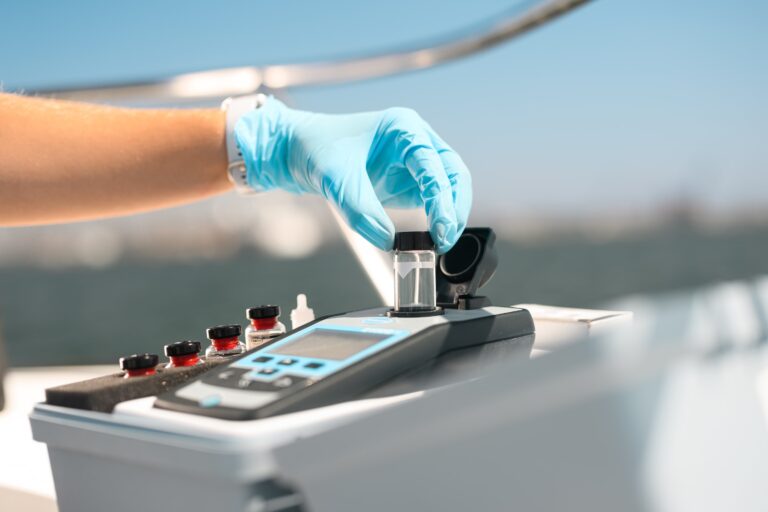
San Diego Coastkeeper’s bilingual volunteer water quality sampling program collects data in the field monthly at ten locations throughout Mission Bay, located in Los Peñasquitos Watershed.
Mission Bay Water Quality
Comparing data across all monitoring sites (marine / saltwater context)
Precipitation on charts: Blue bars show total rainfall (inches) in the 72 hours before each lab sample date, from Open-Meteo for the San Diego area. Each bar is placed on the month of that sample (one value per sampling month).
ND means not detected (below the lab reporting limit for that run) and is displayed as 0 on charts and in data tables. Bacteria readings between 0 and 10 MPN/100mL are labeled <10 (zero stays 0 on charts). Values above 24,000 MPN/100mL are labeled >24,000; charts cap the Y-axis at 25,000 so trends remain visible (original measured values are unchanged in the source data).
Rain bars use the same 72-hour totals before each sample date as the all-sites charts (Open-Meteo).

Become a Volunteer
Become a Volunteer
Mission Bay Sampling Map
Volunteers collect water quality samples and other ambient data from ten sites in Mission Bay, part of Los Peñasquitos Watershed. Explore the sites using the Google Map below.
| List of Sampling Sites |
|---|
| 1. Paradise Point |
| 2. Fiesta Sunset Beach (mid-channel) |
| 3. Rose Creek (freshwater source) |
| 4. Fanuel Street Park |
| 5. Mission Point |
| 6. De Anza Cove |
| 7. Tecolote Creek |
| 8. South Shores (mid-channel) |
| 9. Leisure Lagoon |
| 10. Kendall Frost Marsh |
| 11. Olney Street Outfall (storm event alternative site) |
| 12. Stribely Marsh Outfall (storm event alternative site) |
Results of Data Collection
The results of the data collection are available to view and download here.
Green Results – Passes Water Quality Standards
Red Results – Fails Water Quality Standards
Navigate to a specific section below.
WQM Annual Report | Program Background | Program Goals | Mission Bay Sampling Map | Become a Volunteer | Contact Information
Mission Bay Water Quality Monitoring Program: An Overview
Program Background
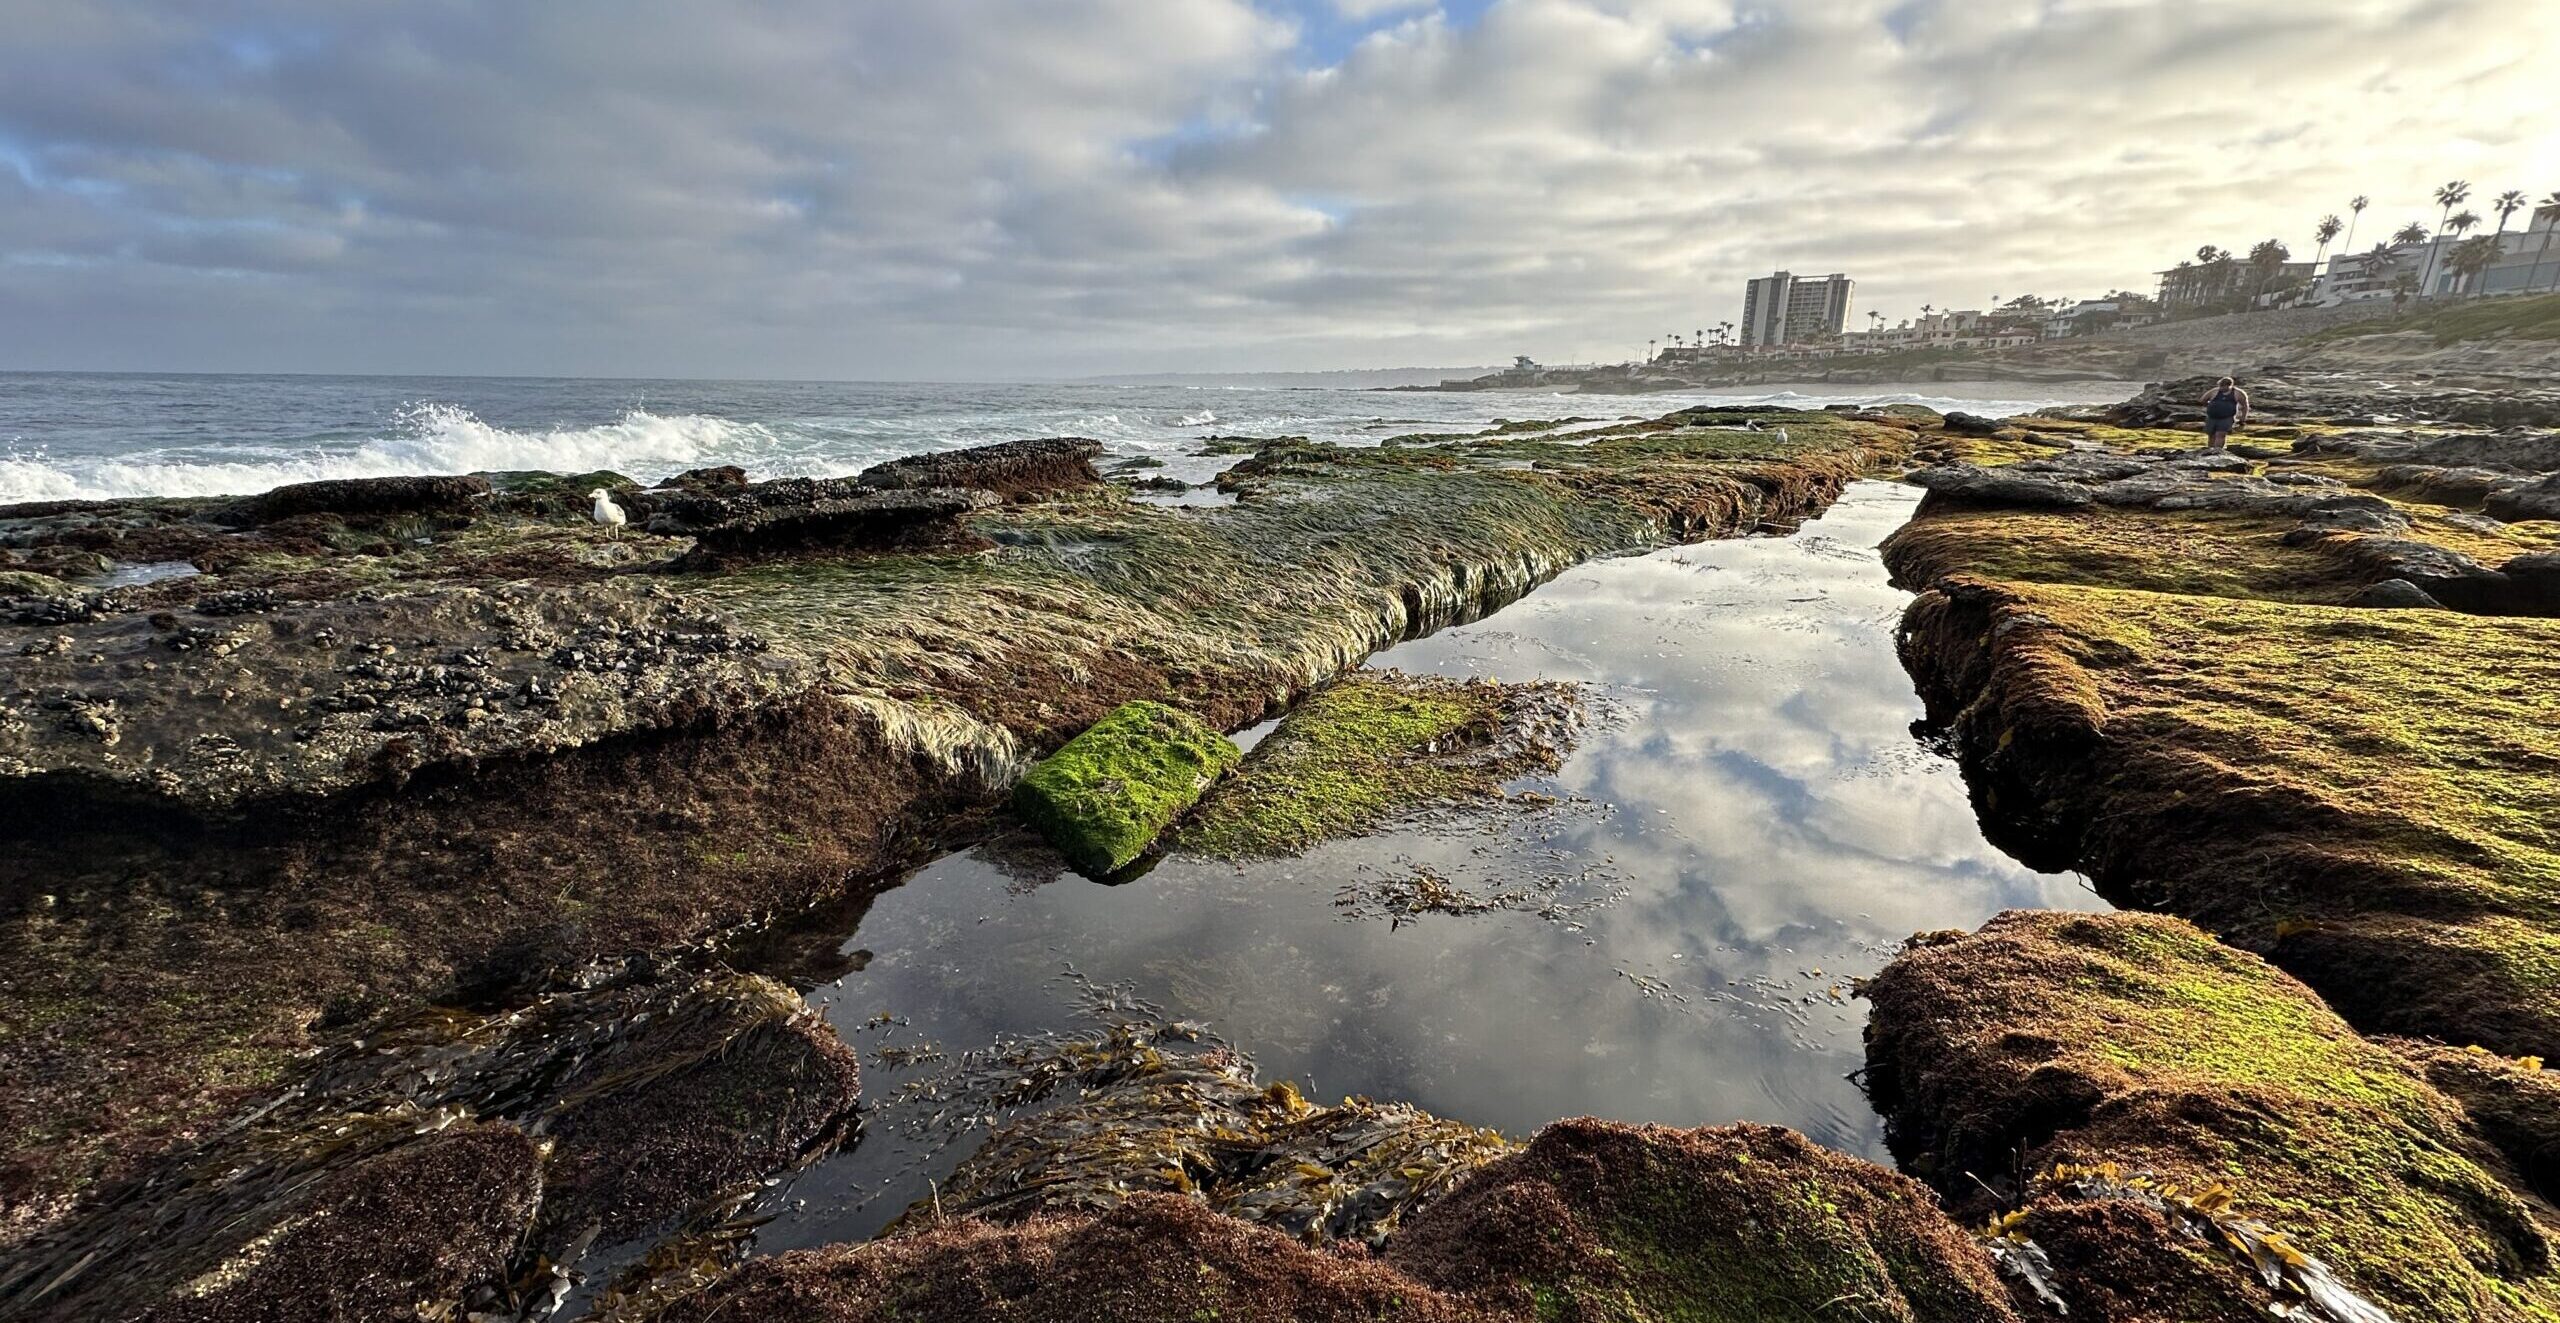
Mission Bay and its surrounding environment are at serious risk of degradation. Development and urbanization in Los Peñasquitos Watershed, along with aging stormwater and wastewater infrastructure, have created conditions where pollution plagues our communities, along with poor water quality, failing water infrastructure, and lack of habitat restoration, which in turn cause illness, urban flooding, erosion, and habitat degradation. Polluted stormwater runoff is the single biggest threat to the health of Mission Bay’s waters. Its persistence has led to the entire Mission Bay and the waterways that flow into Mission Bay, including Rose Creek and Tecolote Creek, being designated on the 303(d) List as pollution-impaired for not meeting federal water quality standards. Urban runoff threatens our habitats and wildlife and poses serious health risks to children, swimmers, subsistence fishers, and beach-going families.
In 2021, Mission Bay had more than 113 days of beach advisories and closures, which are in effect for at least 72 hours following a rainstorm due to high bacteria counts, meaning that San Diegans cannot recreate in, or draw sustenance from, Mission Bay after rain without risking infection or death. In 2020, Mission Bay had more than 252 days of beach advisories and closures.
This program prioritizes water quality improvements, habitat restoration and green infrastructure projects, climate resiliency, and equitable access to this public space.
Program Goals

Environmental Stewardship
- Increase environmental literacy and knowledge among community members.
- Connect volunteers to the outdoors and the environment of the Mission Bay community.
- Improve the ecological health of Mission Bay and Los Peñasquitos Watershed.

Workforce Development
- Build skills through water quality sampling training and data collection.

Equitable Access
- Provide program material and training in both English and Spanish.
- Increase diversity and representation in the conservation and environmental workforce.
- Provide a monthly stipend to volunteers.

Community Engagement
- Connect volunteers to local environmental issues and advocacy efforts.
- Invite volunteers to community events and campaigns.
Become a Water Quality Monitoring Volunteer
Thank you for your interest in our Mission Bay Water Quality Monitoring Program. You can sign up using the form below to get enrolled in our volunteer program listserv to receive updates and learn when we will be offering the next in-person New Volunteer Orientation and Training.
This program creates a pathway for interested community members to:
- Learn the scientific tools they need to understand their local watersheds.
- Become engaged with Mission Bay and the local community.
- Directly influence local resource management by collecting data used to inform regulatory decisions about the protection and management of San Diego’s rivers and streams.
Volunteers are in the field once a month to perform water quality sampling at ten different sites in Mission Bay for approximately three hours. They also engage in community events, meetings, and advocacy efforts. The duration of this program is one year.
Volunteer Resources
Virtual training
In order to participate in a water quality sampling event, volunteers are required to either attend an in-person training, or view the virtual recording and take the mandatory post-training quiz. The quiz has 13 questions, and you are required to obtain at least 10 out of 13 correct in order to qualify as a trained volunteer.
View the recording below, and then take the post-training quiz. By taking this virtual training option, you are able to sign up and participate in any of our water quality sampling events, including those in different watersheds (such as our Chollas Creek program).
Click here to view the recording. Note that the training video is almost one hour long.
After viewing the recording, please take the mandatory Post-Training Quiz here. You are required to answer at least 10 out of the 13 questions correct to qualify as a trained volunteer.
HANDBOOK AND DATA SHEET
Volunteer Stipends
We acknowledge the valuable time and effort needed for this program to achieve its goals. This program provides a stipend to the first ten volunteers who confirm and attend each monthly field day to reduce financial barriers and provide equitable access to this opportunity that would otherwise make it difficult for one to participate. Anyone interested is welcome to apply. Spanish speakers or community members with limited English are highly encouraged to participate.
Check out our events calendar to learn about the next New Volunteer Orientation and Training session, as well as other opportunities to get involved.
Questions?
Contact Lesly Gallegos-Stearns at [email protected] for more information.
Frequently Asked Questions
Programa de Monitoreo de Calidad de Agua en Mission Bay
El programa de muestreo de calidad del agua de voluntarios bilingües de San Diego Coastkeeper recopila datos en el campo mensualmente en diez ubicaciones en Mission Bay, ubicadas en la cuenca de Los Peñasquitos.
Navegar a una sección específica a continuación.
Contexto del programa | Metas del programa | Mapa de sitios de muestreo | Sea un voluntario | Información del contacto
Programa de monitoreo de la calidad del agua de Mission Bay: descripción general
Contexto del programa
Mission Bay y el ambiente alrededor están en grave riesgo de degradación. El desarrollo y la urbanización en la Cuenca de Los Peñasquitos, junto con el envejecimiento de la infraestructura de aguas pluviales y aguas residuales, han creado condiciones en las que nuestras comunidades están plagadas de contaminación, ademas de mala calidad del agua, fallas en la infraestructura del agua y falta de restauración del hábitat, lo que a su vez causa enfermedades e inundaciones urbanas, la erosión y la degradación del hábitat. La escorrentía de aguas pluviales contaminadas es la mayor amenaza para la salud de las aguas de Mission Bay. Su persistencia ha llevado a que todo Mission Bay, así como las vías fluviales que desembocan en Mission Bay, incluyendo Rose Creek y Tecolote Creek, sean designadas en la Lista 303(d) como afectadas por la contaminación por no cumplir con los estándares federales de calidad del agua. El escurrimiento de agua urbana amenaza nuestros hábitats y la vida silvestre, y representa graves riesgos para la salud de los niños, los nadadores, los pescadores de subsistencia y las familias que van a la playa.
En el 2021, Mission Bay tuvo más de 113 días de avisos y cierres de playas, lo cual están vigentes durante al menos 72 horas después de una tormenta debido a un alto recuento de bacterias, lo que significa que los habitantes de San Diego no pueden recrearse en Mission Bay ni obtener sustento de Mission Bay después de la lluvia sin riesgo de infección o muerte. En el 2020, Mission Bay tuvo más de 252 días de avisos y cierres de playas.
Este programa prioriza mejoramientos en la calidad del agua, la restauración del hábitat y los proyectos de infraestructura verde, la resiliencia climática y el acceso equitativo a este espacio público.
Metas del programa
Cuidado del Medioambiente
- Aumentar el vocabulario y el conocimiento ambiental entre los miembros de la comunidad.
- Conectar a los voluntarios con espacios naturales y el medio ambiente de la comunidad de Mission Bay.
- Mejorar la salud ecológica de Mission Bay y la cuenca de Los Peñasquitos.
Desarollo en la Fuerza Laboral Ambiental
- Desarrollar habilidades a través de la capacitación en muestreo de calidad del agua y la recopilación de datos.
Acceso Equitativo
- Proporcionar material del programa y capacitación en inglés y español.
- Aumentar la diversidad y la representación en la fuerza laboral ambiental y de conservación.
- Proporcionar un incentivo mensual a los voluntarios.
Participación en la comunidad
- Conectar a los voluntarios con los problemas ambientales locales y los esfuerzos de abogacía.
- Invitar a voluntarios a eventos y campañas comunitarias.
Mapa de sitios de muestreo en Mission Bay
Los voluntarios recolectan muestras de calidad del agua y otros datos ambientales en diez sitios en Mission Bay, parte de la cuenca de Los Peñasquitos. Explore los sitios usando el mapa de Google a continuación.
| Lista de sitios de muestreo |
|---|
| 1. Paradise Point |
| 2. Fiesta Sunset Beach (a mitad del canal) |
| 3. Rose Creek (fuente de agua dulce) |
| 4. Fanuel Street Park |
| 5. Mission Point |
| 6. De Anza Cove |
| 7. Tecolote Creek |
| 8. South Shores (a mitad del canal) |
| 9. Leisure Lagoon |
| 10. Kendall Frost Marsh |
| 11. Olney Street Outfall (sitio alternativo) |
| 12. Stribely Marsh Outfall (sitio alternativo) |
Mapa de sitios de muestreo de calidad de agua en Mission Bay
Sea un voluntario para el monitoreo de la calidad del agua
Gracias por tu interés en nuestro programa de Monitoreo de Calidad de agua en Mission Bay. Inscribete usando la forma abajo para recibir actualizaciones sobre este programa y cuando tendremos la siguiente orentacion y entrenamiento para voluntarios nuevos.
Este program crea un camino para que los miembros interesados de la comunidad:
- Aprendan las herramientas científicas que necesitan para comprender sus cuencas hidrográficas locales.
- Se involucren con Mission Bay y la comunidad local.
- Influir directamente en el manejamiento de los recursos ambientales locales mediante la recopilación de datos utilizados para informar las decisiones reglamentarias sobre la protección y el manejamiento de los ríos y arroyos de San Diego.
Los voluntarios están en el campo una vez al mes para realizar muestreos de calidad del agua en diez sitios en Mission Bay durante aproximadamente tres horas. También participan en eventos comunitarios, reuniones y esfuerzos de la abogacía. La duración de este programa es de un año.
Recursos para voluntarios
Incentivo para voluntarios
Reconocemos el valioso tiempo y esfuerzo necesario para que este programa logre sus objetivos. Este programa proporciona un incentivo a los primeros diez voluntarios que confirman y asisten a cada día de campo mensual para reducir las barreras financieras y brindar un acceso equitativo a esta oportunidad que de otro modo podría impedir la participación. Cualquier persona interesada es bienvenida a aplicar. Se recomienda que participen aquellos que solo hablan español o los miembros de la comunidad con inglés limitado.
Visita nuestro calendario de eventos para el próximo taller de entrenamiento.
¿Preguntas?
Contacte a Lesly Gallegos-Stearns a [email protected] para más información.