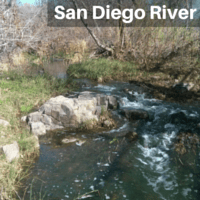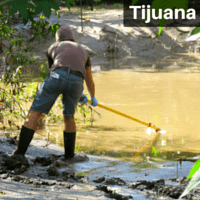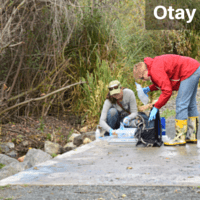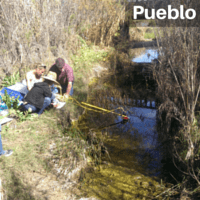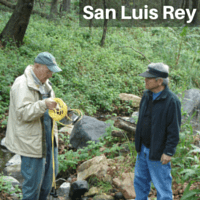


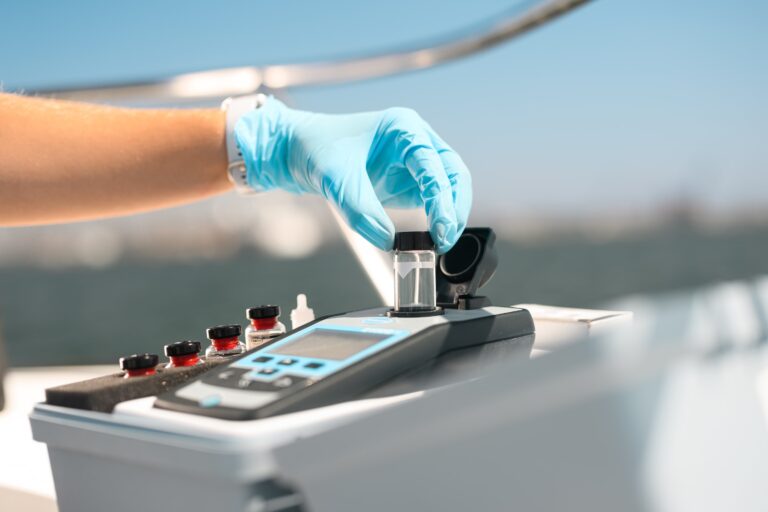

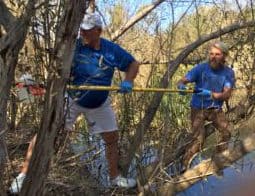
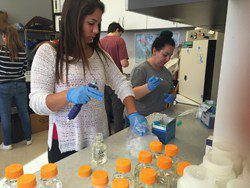
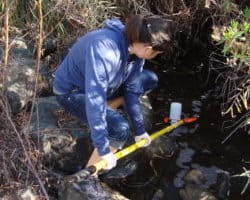
Each month, the trained volunteer scientists on our Water Quality Monitoring team collect water samples from nine of San Diego County’s 11 coastal watersheds. We measure and test the samples in our lab and analyze the data to build an ongoing picture of our county’s water quality, uncover sources of pollution and inform better decision making to protect and restore San Diego County’s fishable, swimmable, drinkable water.
Here are the results of the data collected throughout 2015 in our 2015 Water Quality Report.
Our Fourth Consecutive Year of Drought Continues To Worsen Water Quality
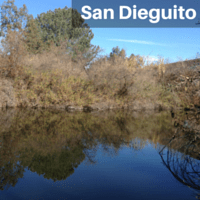
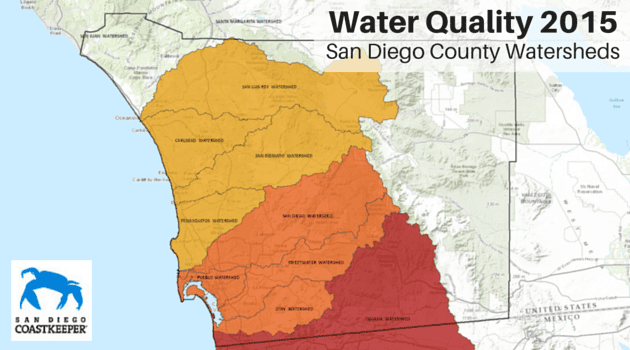
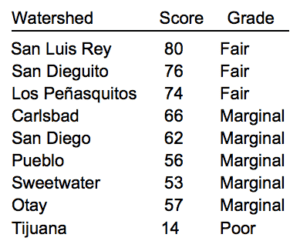
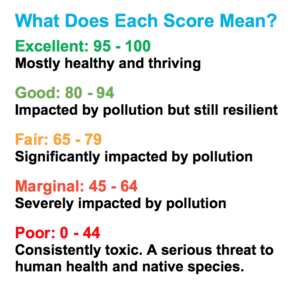
 In 2015, all nine of the watersheds tested as Fair, Marginal or Poor on San Diego Coastkeeper’s Water Quality Index scoring system, all earning the same abnormally low scores as 2014.
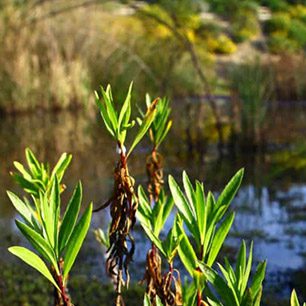
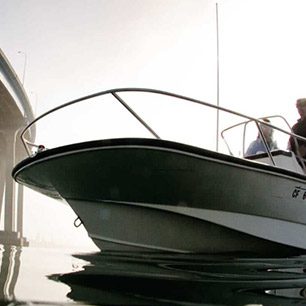
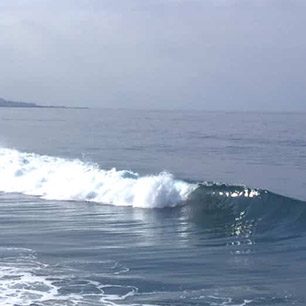
Poor water quality puts significant stress on the vital rivers and streams that we rely upon for everything from flood control and natural filtration of toxins to wildlife preservation. Since our watersheds drain to the Pacific Ocean, these inland water quality issues also make our precious, economy-powering coastline less safe to swim and fish.
Very low water levels as a result of our fourth consecutive year of drought are partially to blame for the continued poor water quality scores. In 2015, we had more sites with water levels so low they were too dry to collect samples than any other year in our recent history.
Our 2015 data reveal low dissolved oxygen concentrations in 38 percent of samples and unhealthy levels of fecal indicator bacteria in 59 percent of samples, both common results of drought conditions. Urban runoff, sewage and industrial pollution are also likely significant contributors to the poor water quality.
Fecal Indicator Bacteria: Our Biggest Concern
 Our water scientists use E. Coli and Enterococcus bacteria as indicators of water contamination by fecal material (animal poop or human sewage). These indicator bacteria are often present in some amount in our inland water, but high levels of them often indicate the presence of dangerous viruses and pathogens that can make you sick.
Over three quarters of our water samples in 2015 contained unsafe levels of fecal indicator bacteria. This means that our rivers and streams are carrying pollutants to the ocean that cause health problems like staph infections, ear aches, stomach issues, rashes, eye infections, and cysts — just to name a few.
When we collected samples 48 hours after a rainstorm in May 2015, every watershed but one exceeded unhealthy levels of Enterococcus. This is why the County’s Department of Environmental Health closes the beaches countywide after it rains — water quality is so poor that it becomes unsafe to swim.
This data also raises a question that we need more research to answer: “Is the drought reducing water levels so much that shallow, slow-moving and warm streams allow Enterococcus and E. coli to stick around much longer?” As in 2014, many of our testing sites in 2015 were so dry that we could not gather samples. We’re curious to explore this question with further research.
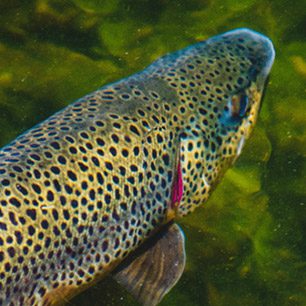
Low Dissolved Oxygen Levels Make It Hard For Aquatic Wildlife To Breathe
 Our 2015 data revealed low dissolved oxygen concentrations in 38 percent of samples. This means our underwater wildlife is in significant distress. We can partially blame drought conditions for this problem, but urban runoff pollution is also a likely contributor.
When rain washes nutrient pollutants, like agricultural and lawn fertilizers, down storm drains and into our watersheds, it supercharges plant growth in our rivers and streams just like it does to grass in our yards. But this growth triggers a nasty chain reaction called eutrophication. Nutrient pollution can fuel massive, unnatural blooms of algae on the water’s surface that grow so big they block the sun from reaching plants below the water. When these plants die from lack of sunlight all at once, they begin to rot all at once too, producing an unnatural amount of bacteria that use up the dissolved oxygen that other wildlife depend on to breath. This puts stress on or kills our underwater wildlife.
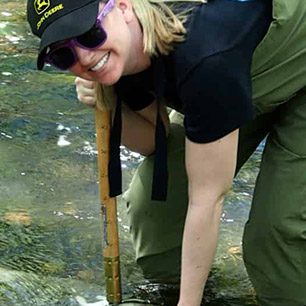
Volunteer-Powered Data
 Our 194 volunteer Water Quality Monitors gave a collective 1,808 hours to collect this important data. In 2015, we trained 74 new Water Quality Monitors and plan to triple our volunteer force by 2018.
Our Water Quality Monitoring program is the largest of its kind in the state and is one of San Diego Coastkeeper’s most powerful tools in protecting and restoring our water. The work of our passionate volunteers generates the vital, scientifically sound data our government agencies can’t collect, allowing us to keep a vigilant watch over San Diego County’s water quality.
In 2011, our Water Quality Monitoring team discovered a 1.9-million sewage spill upstream of the Los Peñasquitos Lagoon. The program provided authorities with the only available baseline water quality data and tracked the lagoon’s recovery. Water Quality Monitor testimony then contributed to a $12 million investment in basic sewage infrastructure, ending San Diego’s “sewage-spill-a-day” reputation.
Click below to check your watershed’s report card.
Read the specific water quality scores for each of the nine tested watersheds below.