


In 2014: Looks like San Diego’s drought affects more than water quantity—and we have the data to show it.
 We proudly announce the results of our 2014 Water Quality Monitoring efforts, and a few key takeaways from this year’s data. One of the most striking trends we see is that our third consecutive year of drought (7.77′ total rainfall in 2014 compared to the 10.34″ average) has likely contributed to inland water quality issues.
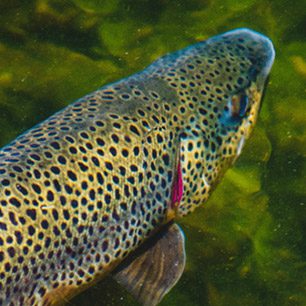
One issue likely related to drought conditions that our 2014 data revealed is low dissolved oxygen concentrations. Turns out that 30 percent of our inland water quality samples that we gathered from across the county measured below healthy levels. Sadly, when dissolved oxygen measurements reach levels this low, aquatic life dies. In April 2014, we even ran across a fish kill in San Luis Rey from just this.

Another trend related to low water levels that shows in our 2014 numbers is that fecal indicator bacteria levels (especially Enterococcus) were a concern across all watersheds. Of our samples in 2014, 57 percent of the Enterococcus samples exceeded healthy standards, and eight of nine watersheds scored marginal or poor for their E. coli scores.
What does this mean?
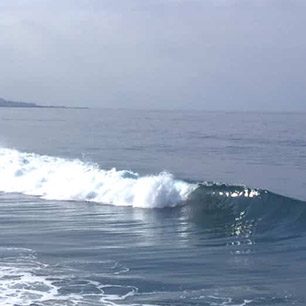
Enterococcus indicates whether water conditions are safe to swim, most commonly used to measure healthy conditions of salt water. Since all of our inland waterways empty to the ocean, it’s not a good sign that we’re measuring so much Enterococcus in our fresh waters. If you don’t know, this means that the water has pollutants in it that can cause staph infection, ear aches, stomach issues, rashes, eye infections, cysts, and others—just to name a few.
To be accurate, there can always be an amount of Enterococcus in our water due to natural causes (aka bird poo), and those may not cause human health impacts. But the levels in our data are so high, we have major concerns. To illustrate the degree to which this is a problem, our December sampling event took place on the day after a heavy rain, and every single sample collected far exceeded healthy levels acceptable for Enterococcus and E. coli. This is why the County’s Department of Environmental Health closes the beaches countywide after it rains–water quality is extremely poor.
These sort of data sets also raise a question that we can’t answer: Is the drought reducing water levels so much that shallow, slow-moving and warm streams create a breeding ground for Enterococcus and E. coli? More so than any other recent year, a lot of our sites even dried up in 2014 so that we couldn’t gather samples. But given our analysis and the increase in water quality impacts shown by fecal indicator bacteria, we’re curious to explore this question. Unfortunately, the data that we collect can’t help us answer this question.
As you can see in the countywide map, Water Quality Index Scores grouped the map’s color-coding into three sections: fair scores in the north, marginal in the middle and poor in the south. We’re not surprised to see this as we think that these groupings of scores relate to the various land-use types and density of development within the watersheds. The north has more open space and agriculture, the middle has more density and developed land area and the south struggles with cross-border water quality management challenges.
We encourage you to click through to each of our nine watersheds to learn more about water quality scores unique to each. This year, San Diego’s coastal watersheds ranged from fair to poor according to our Water Quality Index scoring system.
- Two watersheds scored lower than they did in 2013 (Los Peñasquitos and San Diego—they were good last year)
- One watershed improved its score from 2013, going from Marginal to Fair (Carlsbad)
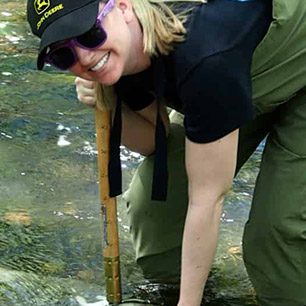
We’re thankful for our 194 volunteers who gave a total of 1,888 hours. And we’re encouraged by our 83 newly trained volunteers from 2014.
What watershed do you live on? Find out and click the watersheds below:
 |
 |
 |
 |
 |
 |
 |
 |
 |