


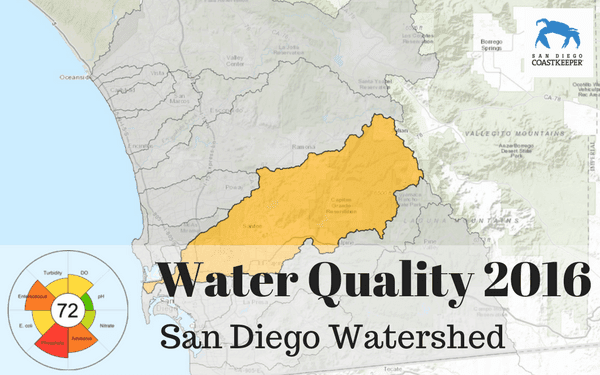
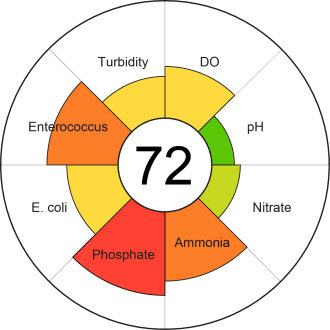
San Diego River Watershed’s Score For 2016: 72, Fair
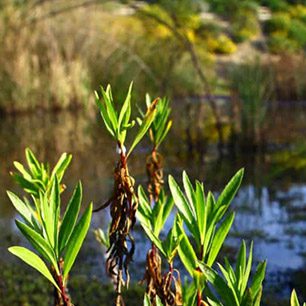
The San Diego watershed stretches from the Cuyamaca Mountains in the east, to the Pacific Ocean in the west, and includes parts of Julian, Alpine, Lakeside, El Cajon, Santee, La Mesa, and San Diego. Nutrient levels were often elevated in our 2016 samples, especially phosphorus, an important factor in stream health. Freshwater streams are often phosphorus limited. This means that a major factor holding back excessive algae growth is a shortage of phosphorus relative to other nutrients in the water. The addition of phosphorus to a phosphorus-limited stream can result in eutrophication, a likely scenario here supported by the occasionally very low levels of dissolved oxygen we measured. Phosphorus can be naturally occurring through the erosion of rocks, but lawn fertilizers and detergents are common human sources.