


 Buena Vista Watershed
 Buena Vista Watershed
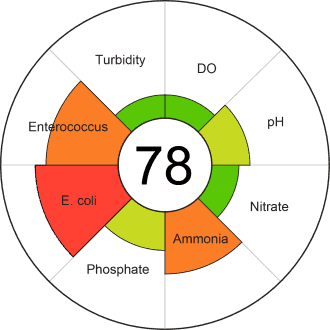
 Overall Water Quality Index Score: 78, Fair
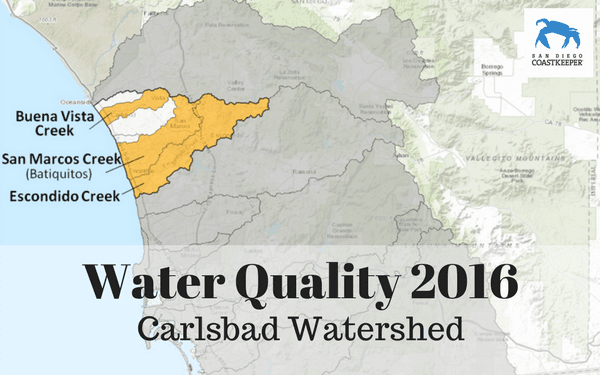
Buena Vista is a small watershed that funnels precipitation from most of the city of Vista and parts of Oceanside and Carlsbad into Buena Vista Lagoon and eventually the Pacific Ocean. Like many of the watersheds we monitor, indicator bacteria were a main concern in 2016.
San Marcos Watershed (Batiquitos)
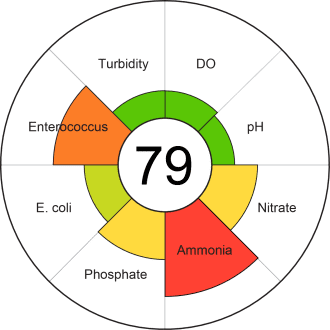
Overall Water Quality Index Score: 79, Fair
The San Marcos Creek watershed originates just a little east of I-15, north of Escondido, includes portions of San Marcos, Encinitas and Carlsbad, and drains into the Batiquitos Lagoon before reaching the Pacific Ocean. Water quality scores were fair to good for much of the year, with one large deviation at one of our sites in November when our volunteers reported the water to be milky white in color and the ammonia concentration was extremely elevated. We suspect a one-time spill may have occurred nearby, but are keeping an eye for evidence of an ongoing problem there.
Escondido Creek Watershed
 Escondido Creek Watershed
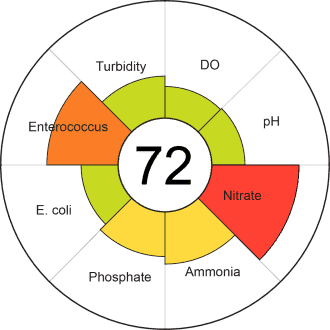
 Overall Water Quality Index Score: 72, Fair
The Escondido Creek watershed reaches from Bear Valley to the Pacific Ocean, and is drained by Escondido Creek into San Elijo Lagoon and ultimately the Pacific Ocean. The watershed includes parts of Escondido, Rancho Santa Fe, Solana Beach, and Encinitas. The water quality story in Escondido Creek in 2016 (and all previous years) is dominated mainly by very high nitrate concentrations. Some typical sources of excessive nitrates include fertilizer runoff from residential, agricultural or recreational areas like golf courses; or from detergents getting into the storm drains. Our long time volunteers in this watershed see massive algae blooms each year as a result.
How to read our water quality pie charts: these handy charts are designed to give you a sense of which of the factors we measured contributed to the overall water quality score (the number in the center) for each watershed. The size/color of the pie slice gets larger/warmer with increased frequency and magnitude of deviations from good water quality standards for each indicator.