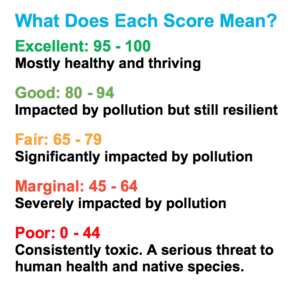


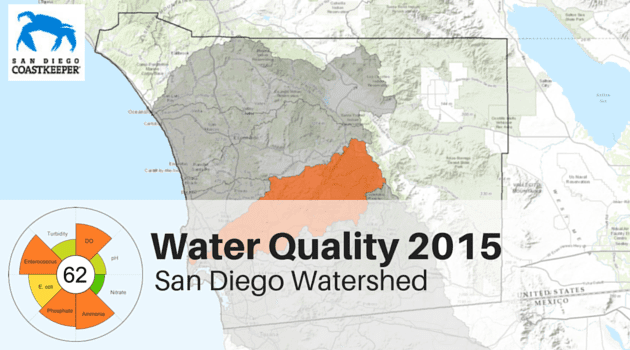
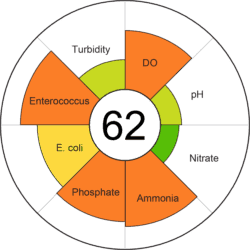
Water Quality Index Score: 62, Marginal
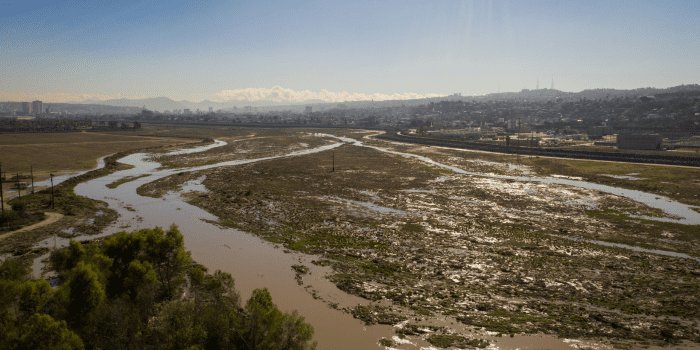
The San Diego River had another bad year.
Key data takeaways include:
- Commonly high levels of phosphorus and ammonia
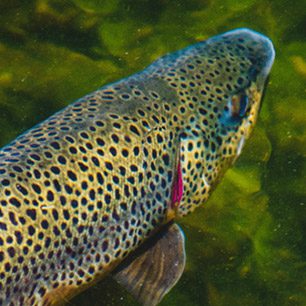
- Dissolved oxygen at the Fashion Valley site continued to be very low – even in the winter when it is usually higher
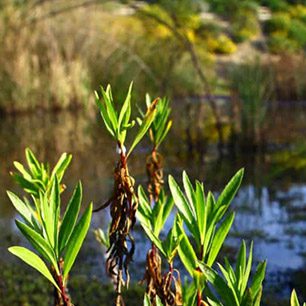
- Repeated reports from our volunteers noting excessive amounts of algae and duckweed
- Volunteers repeatedly reported lots of trash
Four Symptoms of One Phenomenon: Urban Runoff
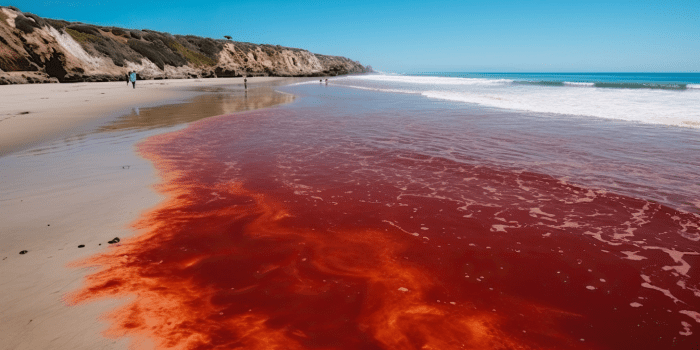
All four of these bullet points are related, indicating a chain reaction likely triggered by urban runoff. Rain washes pollutants from our urban areas down our storm drains and into our watersheds. These pollutants include trash, like that reported by volunteers as well as fertilizers we use for our lawns and landscaping. These fertilizers contribute to high levels of phosphorous and ammonia which supercharge plant growth. In the San Diego River’s case, this meant large blooms of algae and duckweed. This growth blocks sunlight from reaching plants beneath the water, causing them to die and begin to rot all at once. The rotting produces an unnatural surge of bacteria that use up the dissolved oxygen that aquatic wildlife depend on to breathe. This phenomenon was so prevalent in the San Diego River that for two consecutive months, we measured dissolved oxygen at deadly low levels (called anoxic, <0.5 mg/L).
The San Diego River is also an example of how lower water levels caused by the drought affect our water quality. We estimate that the San Diego River’s low water levels in 2015, contributed to slower water flow and warmer temperatures. This likely exacerbated the river’s problems by creating a better breeding ground for explosive algae growth.