Learn about our mission, values, and impact on coastal conservation. Join us in protecting San Diego's waters.
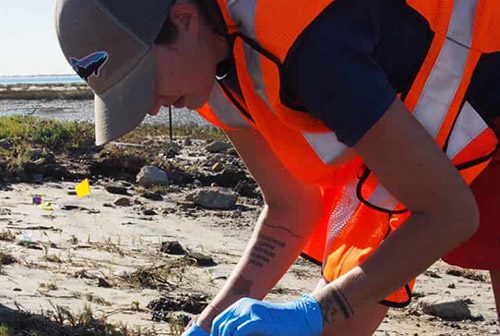
Our AccomplishmentsDiscover our successes in safeguarding San Diego's waterways. From clean water initiatives to marine conservation efforts, see how we make a difference.
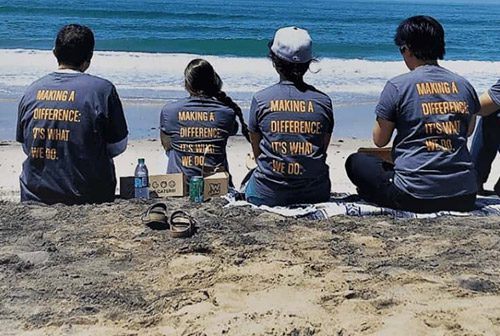
Employment OpportunitiesSan Diego Coastkeeper periodically seeks to add talented individuals to our passionate team of educators, advocates, scientists, outreach specialists, and non-profit professionals.
The people behind our organization make our vision for clean water, vibrant communities, and a healthy environment possible. Learn more about our board of directors and staff.
Dig deeper into our annual reports, financial statements, and tax returns.
Have questions or want to get involved? Reach out to San Diego Coastkeeper. We're here to help keep water clean, safe, and affordable.
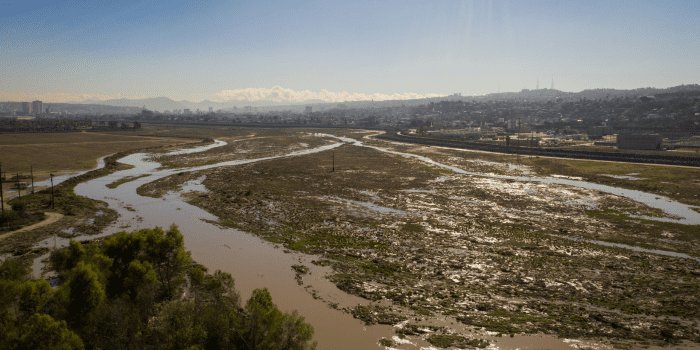
Learn about our integrated One Water approach, which prioritizes multi-benefit solutions, community health, and environmental resilience.
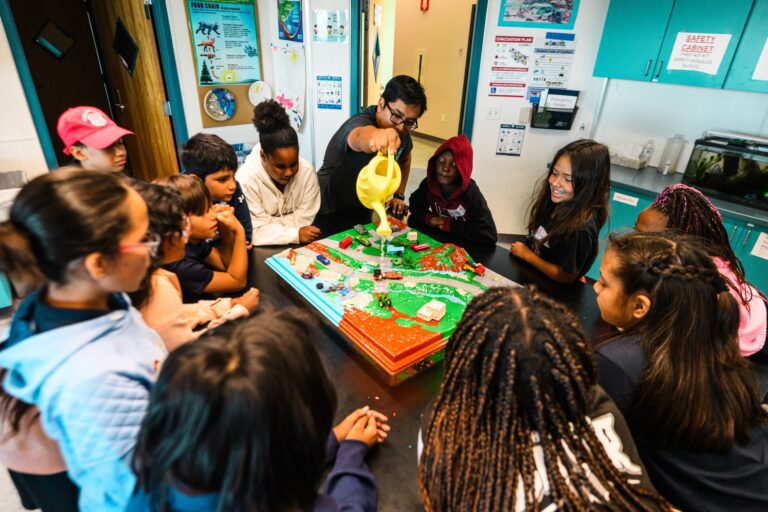
Science to Stewardship is a place-based education program connecting high school students with local water quality issues...
Participating in a beach or neighborhood cleanup is a great way to have an immediate positive impact on the environment.
Our one-of-a-kind program engages Black, Indigenous, and People of Color (BIPOC) high school students in year-long environmental science education